Introducing the R package frontiermetrics: how does deforestation progress in space and time?
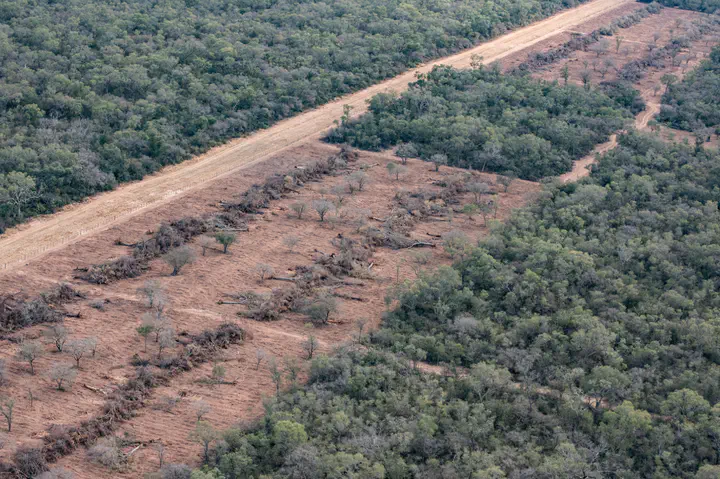 © Osvaldo Tesoro / Greenpeace
Deforestation frontiers drive major biodiversity loss, carbon emissions, and ecosystem degradation, yet how they unfold in space and time remains poorly understood despite better remote sensing data.
frontiermetrics is a new R package that derives a consistent, robust set of metrics to characterize the deforestation process for ecological and conservation research.
It calculates eight frontier metrics, measuring speed, severity, and spatio-temporal patterns, through a flexible, standardized, repeatable workflow.
Two case studies demonstrate its potential: comparing frontier impacts across tropical regions with Global Forest Watch data, and providing insights into protected-area effectiveness with user-derived time series of forest loss.
By standardizing frontier monitoring, frontiermetrics supports evidence-based conservation planning and robust comparisons of deforestation trends across regions.
See the full paper here: Huais, P. Y., Buchadas, A., Lacerda, E., Nori, J., Baumann, M. and Kuemmerle, T. (2026), frontiermetrics: An R Package for Characterizing Deforestation Frontiers. Remote Sensing in Ecology and Conservation, 2026; 0:1–9.